Monitoring of each Kubernetes component is very important, and Calico is not exception. Today I learned that Calico provides capabilities to export Prometheus metrics out of the box.
However, Official documentation is a bit misleading and examples from it doesn’t work with Prometheus installed via Kube-stack-protmetheus.
In this post I’ll show how you can get Calico Monitoring up and running.
Prerequisites
- A running EKS cluster.
- Calico CNI is installed
- Prometheus installed via
kube-stack-prometheus
I’ve installed Helm Chart with the name kube-stack-prometheus, you might need
to change release: kube-stack-prometheus to the one matching your release
name.
Installation
Enable metrics reporting
This can be done via YAML at Calico installation step:
kubectl patch felixconfiguration default --type merge --patch '{"spec":{"prometheusMetricsEnabled": true}}'
kubectl patch installation default --type=merge -p '{"spec": {"typhaMetricsPort":9093}}'
kubectl patch kubecontrollersconfiguration default --type=merge  --patch '{"spec":{"prometheusMetricsPort": 9095}}'
Create calico-typha and calico-felix services
They will expose metrics-port( calico-kube-controllers-metrics service will
be created automatically):
apiVersion: v1
kind: Service
metadata:
  labels:
    k8s-app: calico-typha
  name: typha-metrics-svc
  namespace: calico-system
spec:
  clusterIP: None
  ports:
  - name: metrics-port
    port: 9093
  selector:
    k8s-app: calico-typha
---
apiVersion: v1
kind: Service
metadata:
  labels:
    k8s-app: calico-felix
  name: felix-metrics-svc
  namespace: calico-system
spec:
  clusterIP: None
  ports:
  - name: metrics-port
    port: 9091
  selector:
    k8s-app: calico-node
Create ServiceMonitor watching for all Calico services
We need to add label release: kube-stack-prometheus for Prometheus to pick
up this ServiceMonitor:
apiVersion: monitoring.coreos.com/v1
kind: ServiceMonitor
metadata:
  labels:
    release: kube-stack-prometheus
  name: calico
  namespace: calico-system
spec:
  endpoints:
  - port: metrics-port
  selector:
    matchExpressions:
    - key: k8s-app
      operator: In
      values: [ "calico-felix", "calico-typha","calico-kube-controllers" ]
(Optional) Add Calico to your Grafana:
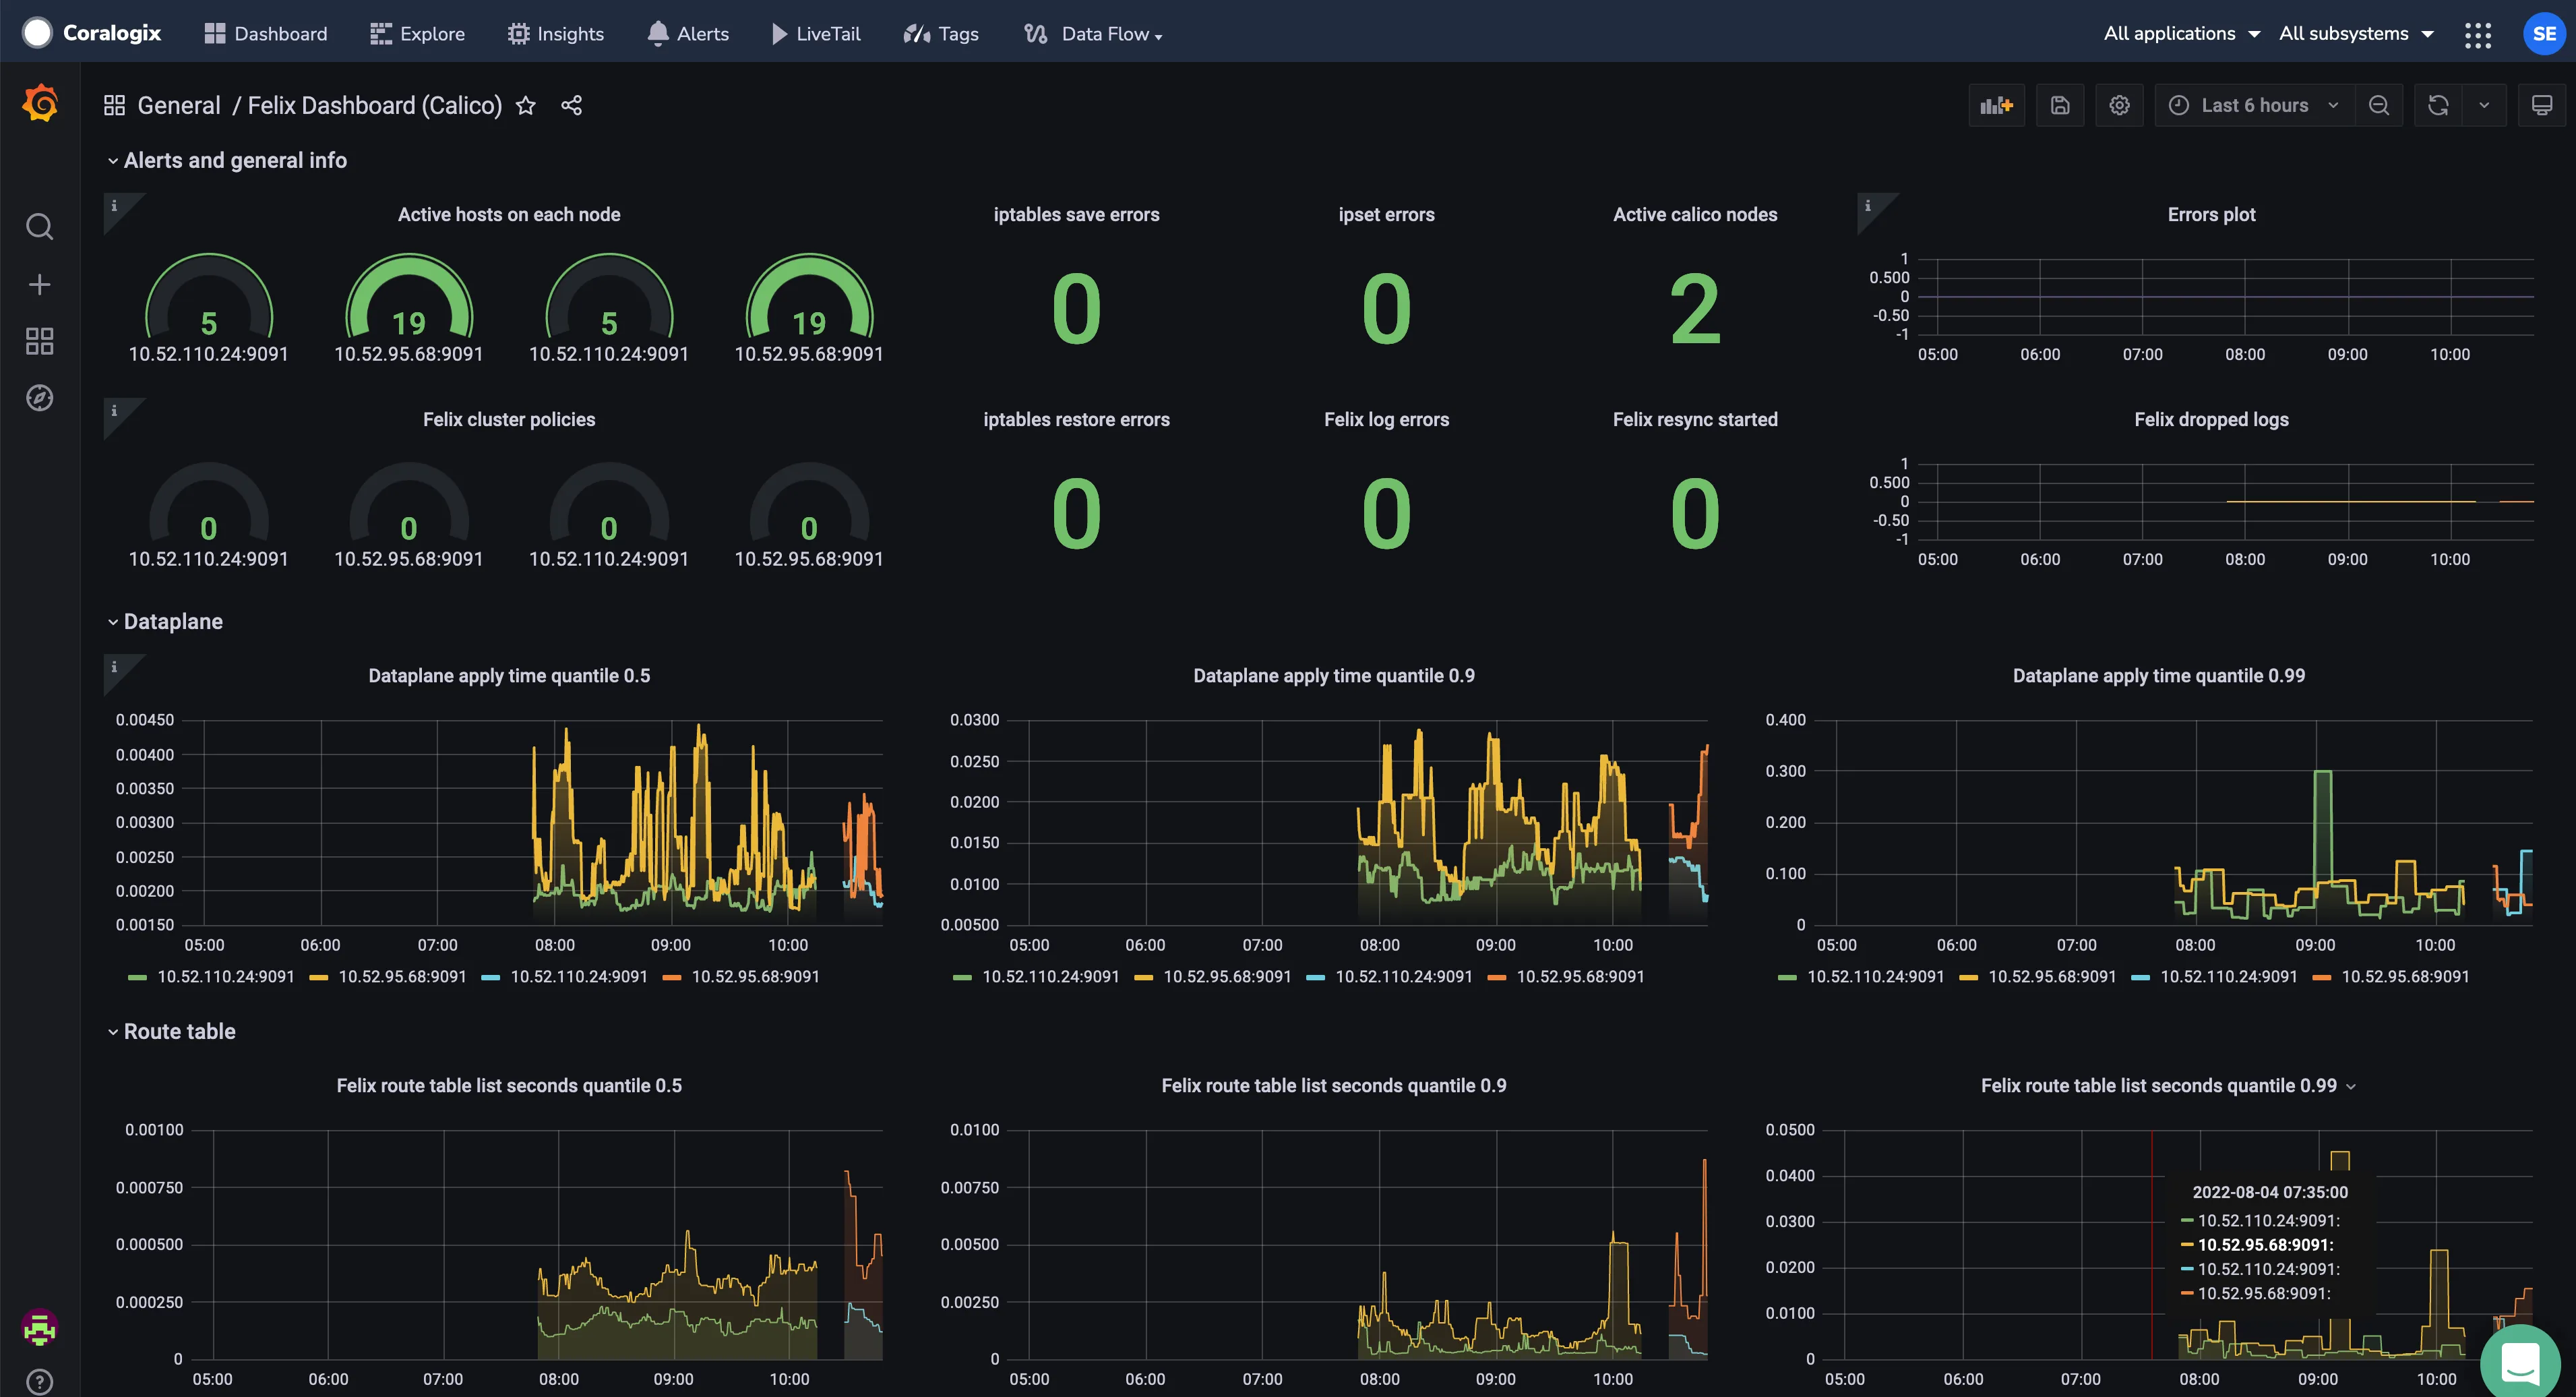
Select + → Import → Enter 12175 (Pre-built Felix Dashboard)
If everything works, you should see something like this: