I continue my adventures with TrueNas Scale. After configuring UPS I wanted to see the UPS graphs on the reporting page, but they were empty.
As it turns out, now reporting for UPS is broken, and you have to dig deep to make it work due to the following reasons:
- CollectD Debian maintainers disabled nut plugin starting with 5.9 changelog
- NUT was removed from the middlewared reporting plugin commit
Considering all that, I definitely wouldn’t recommend spending time on it and making reporting work. But if you’re ready for possible crashes or breaks on each update, you can follow me with the steps below.
Install missing CollectD nut plugin
This can be done via compiling CollectD, but much easier for me was to extract lib from the old package:
wget http://ftp.de.debian.org/debian/pool/main/c/collectd/collectd-core_5.8.1-1.3_amd64.deb
dpkg -x collectd-core_5.8.1-1.3_amd64.deb /tmp/out
/tmp/out/usr/lib/collectd/nut.so
cp /tmp/out/usr/lib/collectd/nut.so /usr/lib/collectd/
Enable nut CollectD plugin
Add the following lines to the collectd configuration:
LoadPlugin nut

<Plugin "nut">
  UPS "ups@127.0.0.1:3494"
</Plugin>
Make sure the UPS address matches the one you’ve used with uspc commend.
And restart the CollectD daemon:
systemctl restart collectdAfter restart, you should see *.rrd files:
root@truenas ~# ll /var/db/collectd/rrd/127.0.0.1/nut-ups/*
-rw-r--r-- 1 root root 148648 Nov 17 12:12 /var/db/collectd/rrd/127.0.0.1/nut-ups/current-output.rrd
-rw-r--r-- 1 root root 148648 Nov 17 12:12 /var/db/collectd/rrd/127.0.0.1/nut-ups/frequency-input.rrd
-rw-r--r-- 1 root root 148648 Nov 17 12:12 /var/db/collectd/rrd/127.0.0.1/nut-ups/frequency-output.rrd
lrwxrwxrwx 1 root root      7 Nov 16 18:54 /var/db/collectd/rrd/127.0.0.1/nut-ups/nut-ups -> nut-ups
-rw-r--r-- 1 root root 148648 Nov 17 12:12 /var/db/collectd/rrd/127.0.0.1/nut-ups/percent-charge.rrd
-rw-r--r-- 1 root root 148648 Nov 17 12:12 /var/db/collectd/rrd/127.0.0.1/nut-ups/percent-load.rrd
-rw-r--r-- 1 root root 148648 Nov 17 12:12 /var/db/collectd/rrd/127.0.0.1/nut-ups/temperature-ups.rrd
-rw-r--r-- 1 root root 148648 Nov 17 12:12 /var/db/collectd/rrd/127.0.0.1/nut-ups/timeleft-battery.rrd
-rw-r--r-- 1 root root 148648 Nov 17 12:12 /var/db/collectd/rrd/127.0.0.1/nut-ups/voltage-battery.rrd
-rw-r--r-- 1 root root 148648 Nov 17 12:12 /var/db/collectd/rrd/127.0.0.1/nut-ups/voltage-input.rrd
-rw-r--r-- 1 root root 148648 Nov 17 12:12 /var/db/collectd/rrd/127.0.0.1/nut-ups/voltage-output.rrd
Make RRD visible to middlewared
The way CollectD creates folder for the NUT is that it’s using UPS address as folder name. This way, middlewared does not see those files more info
This can be fixed with the symlink:
ln -s /var/db/collectd/rrd/127.0.0.1/nut-ups/ /var/db/collectd/rrd/localhost/nut-upsUpdate middlewared plugins.py
As I already mentioned, right now NUT support is removed from the middlewared reporting plugin.
But it’s just a simple python script, which everyone can fix. I’ve forked the repo, restoring NUT and adding couple additional Graphs plugins.py
Backup original version of the /usr/lib/python3/dist-packages/middlewared/plugins/reporting/plugins.py,
replace it with one that supports NUT monitoring and restart middlewared:
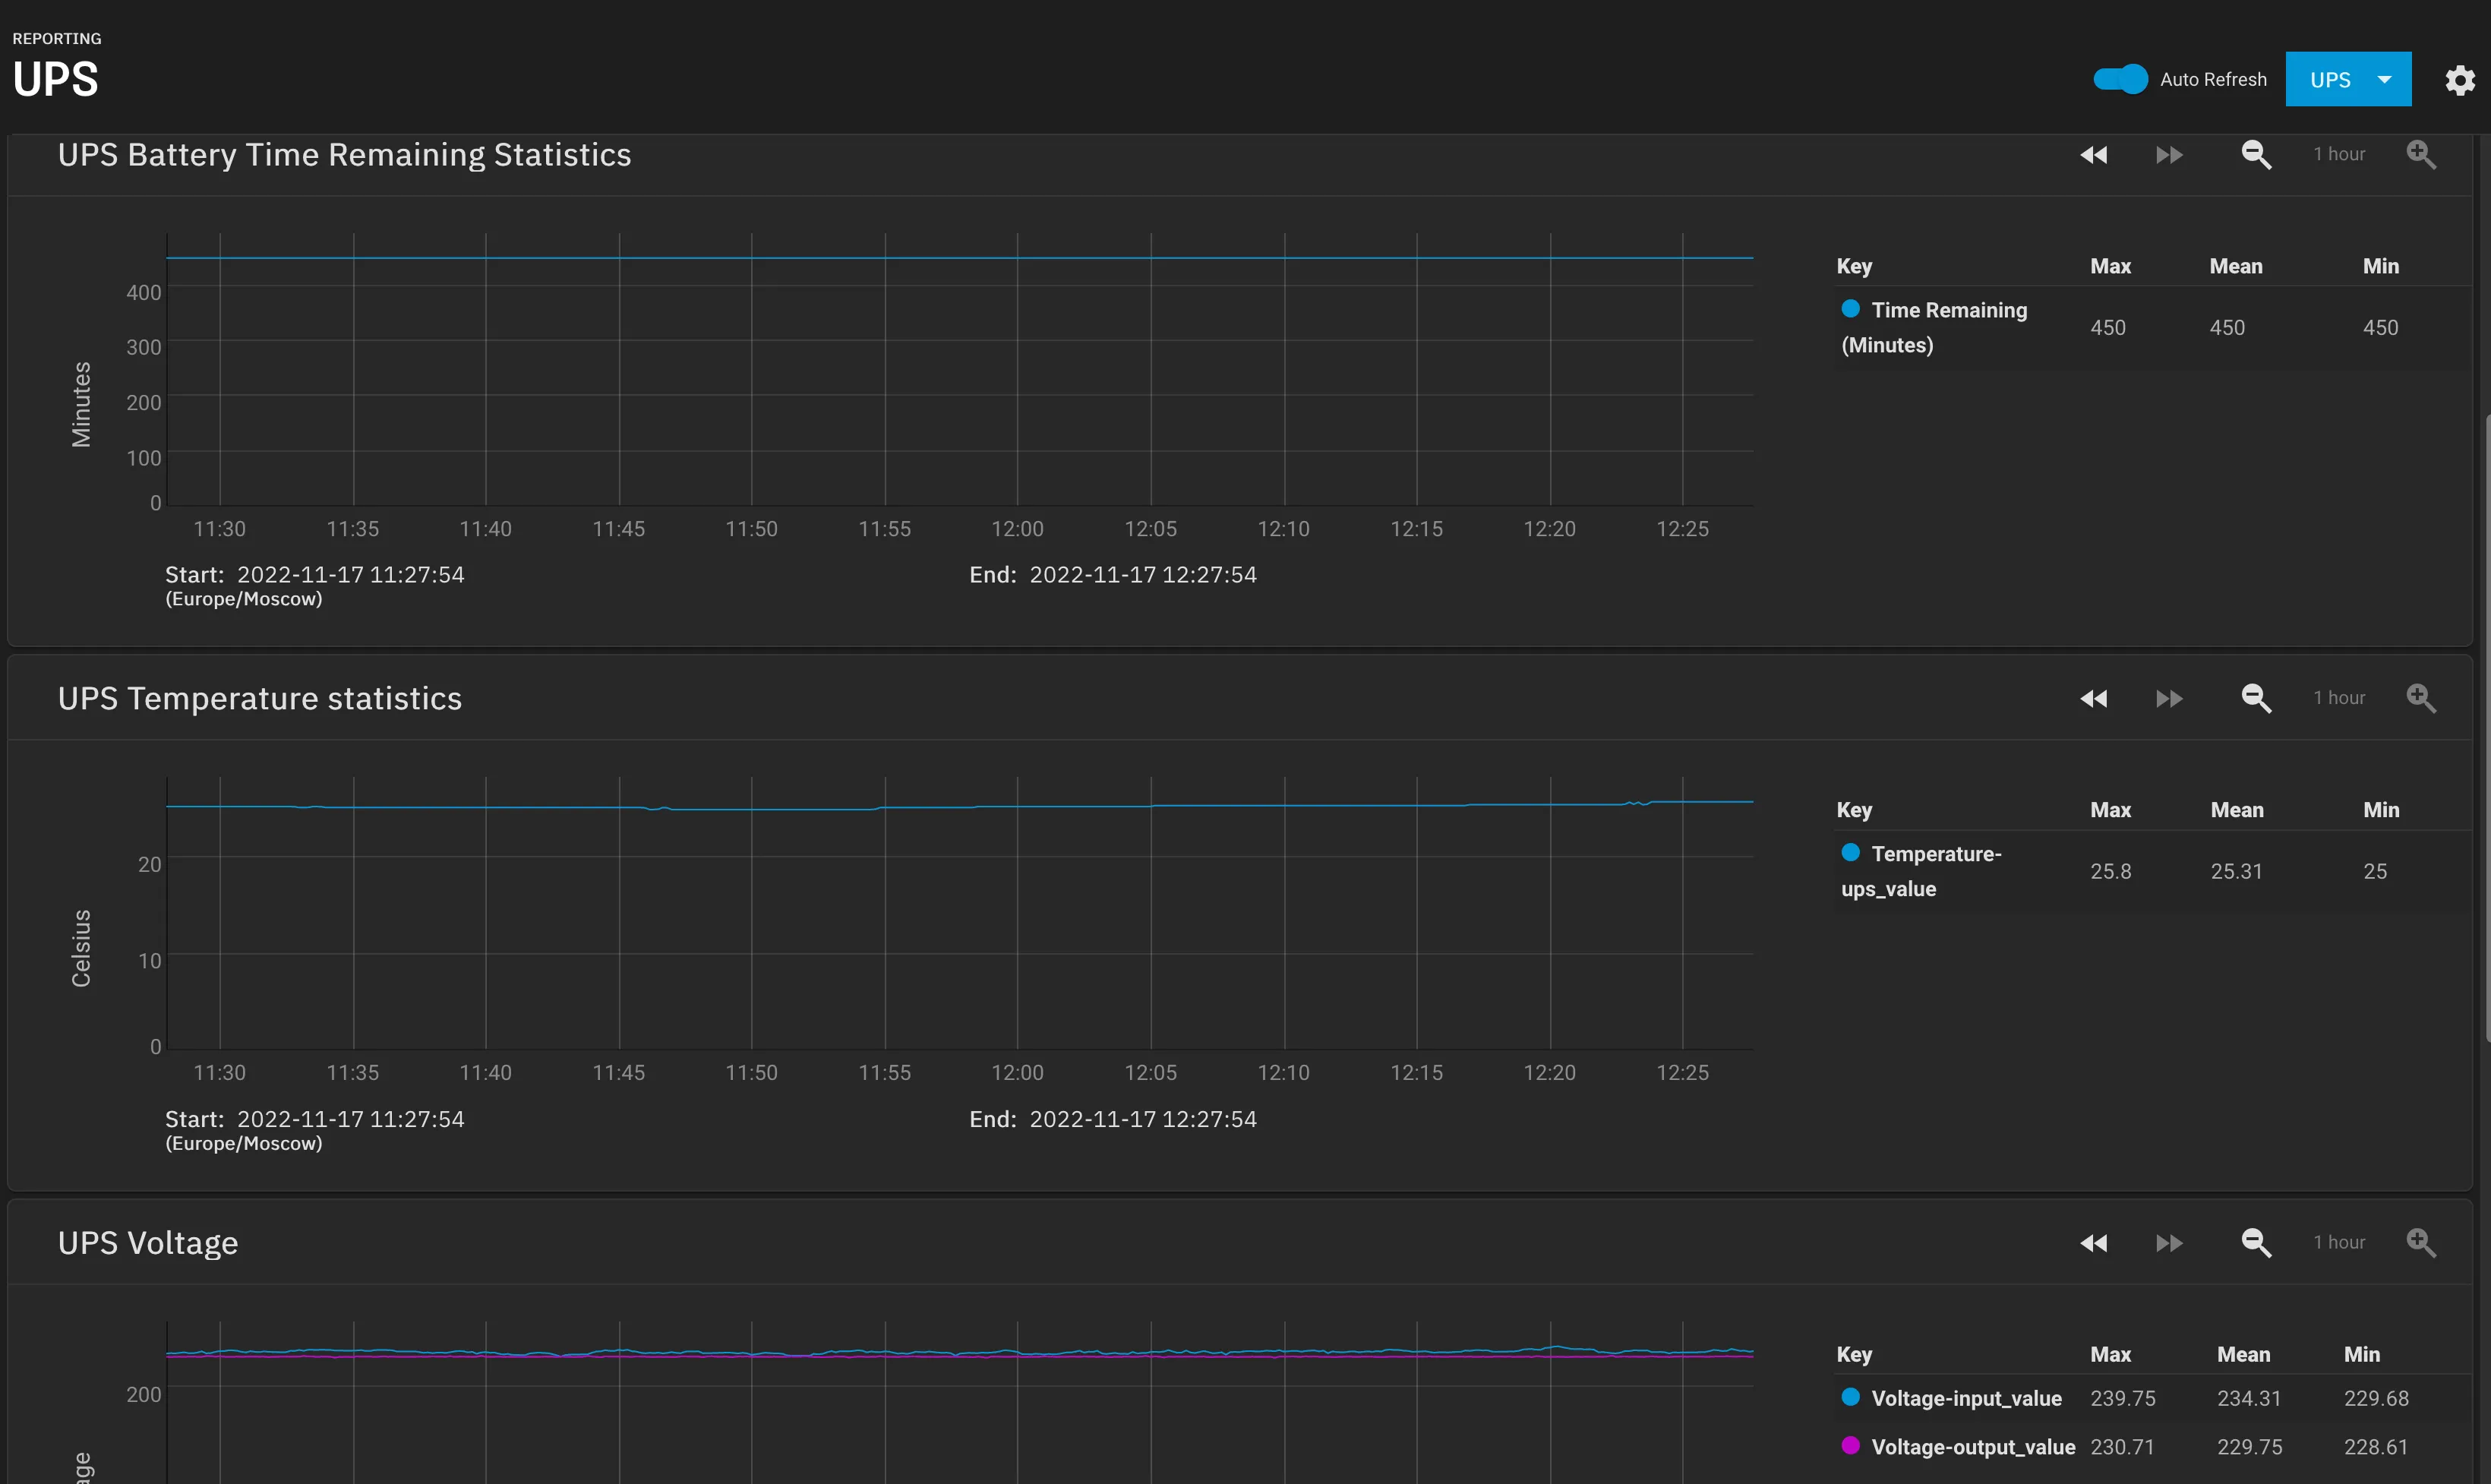
systemctl restart middlewaredIf everything was done correctly and with some luck, you should see NUT graphs at the reporting UPS page: