If you’re an active user of GitHub API, pretty soon you’ll reach your account’s rate limit - 5000 requests per hour for authenticated user.
To overcome this limitation, you can split your workload among different workloads, use conditional requests which does not count against your Rate Limit or use GitHub Apps(described later in this article).
In any case, knowing your current usage is crucial to prevent service downgrade due to rate limiting.
In this article, I will share my experience on how this data can be retrieved and exported to Prometheus.
Monitoring Rate Limits for the authenticated user.
Rate limits can be retrieved
through the /rate_limit endpoint. We’re interested in the core object
instead of the rate object(which will be deprecated):
{
  "resources": {
    "core": {
      "limit": 5000,
      "remaining": 4999,
      "reset": 1372700873
    },
...
The easiest way to authorize as a user is to Create a Personal Access Token:
- Issue a new token at
https://github.com/settings/tokens - Use it to send GET request to the
/rate_limitendpoint:
curl -H "Authorization: token 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" https://api.github.com/rate_limitPersonal Access Token doesn’t expire, so they’re well suited for automation or monitoring.
Next thing to do is to configure Prometheus exporter. json_exporter provides all the functionality required to access API with token out of the box. All that you have to do is to set up configuration file and bearer token. Here’s an example of configuration file exporting values in core object:
metrics:
- help: Total number of API requests in core per hour
  labels:
    name: github-account-name
  name: github_account_name_core
  path: '{.resources.core}'
  type: object
  values:
    limit: '{ .limit }'
- help: Remaining amount of API requests to core per hour
  labels:
    name: github-account-name
  name: github_account_name_core
  path: '{.resources.core}'
  type: object
  values:
    remaining: '{ .remaining }'
- help: Used API requests to core in this hour
  labels:
    name: github-account-name
  name: github_account_name_core
  path: '{.resources.core}'
  type: object
  values:
    used: '{ .used }'

headers:
  Accept: application/vnd.github.v3+json

http_client_config:
  tls_config:
    insecure_skip_verify: true
  bearer_token_file: /tmp/secret/github-account-name-monitoring-exporter
Now exporter can be run as:
json_exporter --config.file=config.ymlBy default, it will listen on port 7979 and, if you’ve configured everything
correctly, will give you following reply:
$ json_exporter --config.file=config.yaml --log.level=debug &
# curl localhost:7979
...
# HELP github_account_name_core_limit Total number of API requests in core per hour
# TYPE github_account_name_core_limit untyped
github_account_name_core_limit{name="github-account-name"} 5000
# HELP github_account_name_core_remaining Remaining amount of API requests to core per hour
# TYPE github_account_name_core_remaining untyped
github_account_name_core_remaining{name="github-account-name"} 3985
# HELP github_account_name_core_used Used API requests to core in this hour
# TYPE github_account_name_core_used untyped
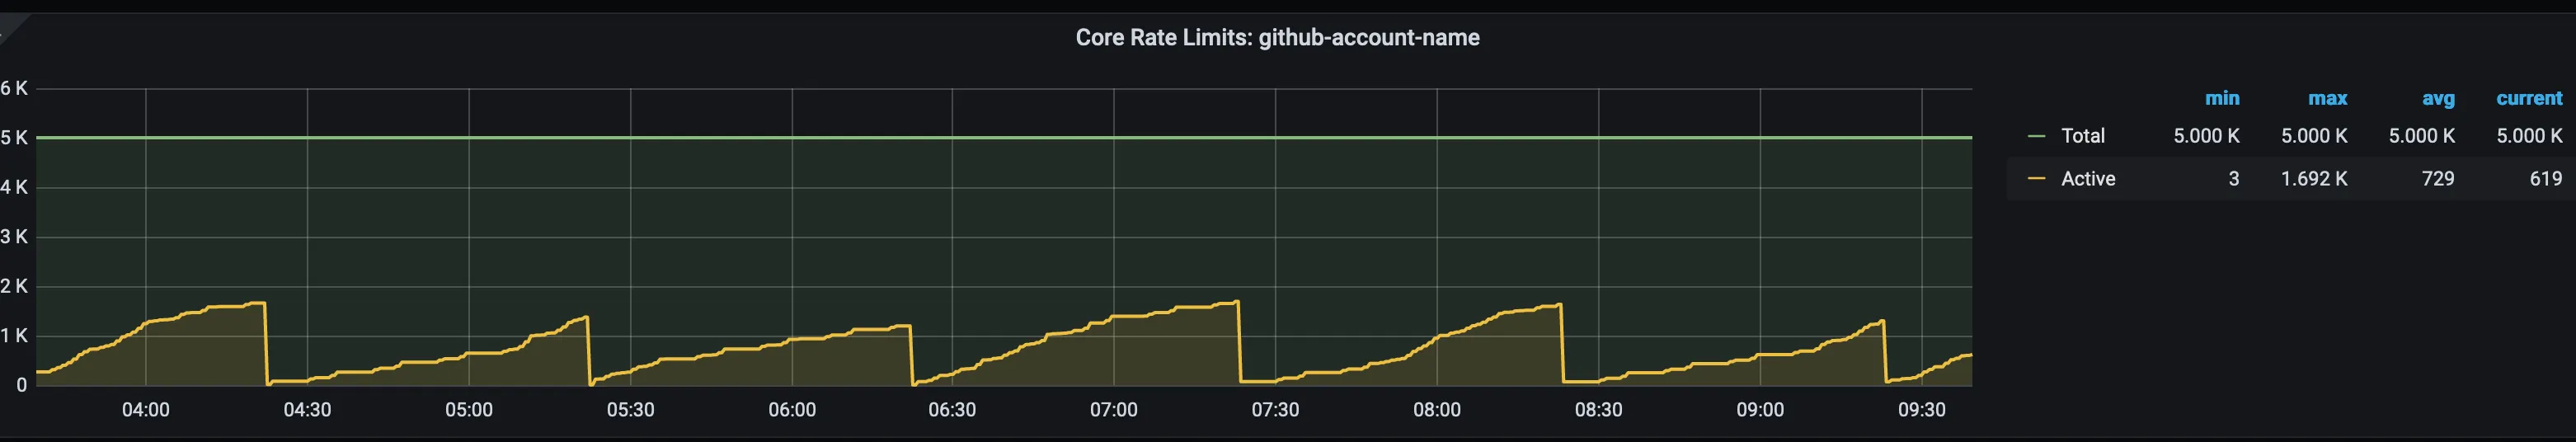
github_account_name_core_used{name="github-account-name"} 1015Now you can add exporter to Prometheus data sources and create dashboards to receive something like this:
Also prometheus-community offers json-exporter
Docker image, which you can deploy to your infrastructure and tune
configuration file as needed. If you deploy to Kubernetes and monitor many
GitHub accounts, it may be wise to create Helm Chart(which we did, but I can’t
share it here).
Monitoring Rate Limits for the GitHub App
Using GitHub Apps is a slightly different approach to interact with Github API as
it uses more complex authentication than authenticating as a user. On the bright
side, Rate limits for GitHub Apps
are higher, and can reach up to 15000 requests per hour. To get rate limits
for the App, you have to use the same /rate_limit endpoint.
- Generate application private key
- Get JWT using Application private key(JWT has 10-minute life). With valid
JWT, you can access
/appendpoint, receiving various information about application and its installations. Rate limits are calculated for specific installation and we need to get thatinstallation_id. - Get
installation_idthrough the APIhttps://api.github.com/app/installationsor through the web interface(Click on the gear wheel on the desired installation, i.e. https://github.com/apps/github-app-name/installations/<installation_id>) - Get Installation token using JWT(Token has 1-hour life) and
installation_id - Now you can access endpoints, including
/rate_limit, using the App installation token
Unfortunately, json-exporter doesn’t support such workflow. But using one of
the GitHub API libraries
you can write your own exporter. I’ll share how I did this in Python, using
PyGithub and
prometheus-client.
You can use something like this function to retrieve the installation token:
from github import GitHub, GithubIntegration
...
def get_installation_token(self, id, private_key, installation_id):
    """
    Return GitHub app installation token
    """

    app = GithubIntegration(id, private_key)
    LOGGER.debug("GitHub app initialized")

    try:
        LOGGER.debug("Requesting github app installation_token")
        installation_token = app.get_access_token(installation_id).token
        LOGGER.debug("GitHub app installation_token received")
    except Exception:
        LOGGER.error(
            "Unable to get installation token,\
                GITHUB_APP_INSTALLATION_ID or \
                GITHUB_APP_PRIVATE_KEY is invalid!"
        )
        sys.exit(1)
    return installation_token
...
With installation token, /rate_limit endpoint can be accessed:
def get_limits(self):
    """
    Return GitHub app rate limits
    """
    g = GitHub(installation_token)
    try:
        LOGGER.debug("Requesting github app rate limits")
        rate_limits = g.get_rate_limit()
        LOGGER.info(f"Received rate limits: {rate_limits}")
    except Exception:
        LOGGER.warning(
            f"Unable to get rate limits, retrying in \
                {GH_REQUEST_TIMEOUT} seconds..."
        )
        time.sleep(GH_REQUEST_TIMEOUT)
        LOGGER.debug("Re-initializing")
        self.__init__()
        rate_limits = g.get_rate_limit()
    finally:
        return rate_limits
Finally, check out this answer on StackOverflow
to have an idea of how prometheus-client can be used to export Prometheus
metrics.
Our collect function might look like this:
from prometheus_client import start_http_server
from prometheus_client.core import REGISTRY, GaugeMetricFamily
...
    def collect(self):
        """
        Collect metrics from GitHub /rate_limits and export them as Gauge
        """
        rate_limits = self.get_limits()
        g_core = GaugeMetricFamily(
            f"github_app_{self._app_name}_core",
            "API requests in core per hour",
            labels=["type"],
        )
        g_core.add_metric(["limit"], rate_limits.core.limit)
        g_core.add_metric(["remaining"], rate_limits.core.remaining)
        yield g_core
...
Now let’s run our app and collect rate limit metrics:
curl http://localhost:8080
...
# HELP github_app_name_core API requests in core per hour
# TYPE github_app_name_core gauge
github_app_name_core{type="limit"} 15000.0
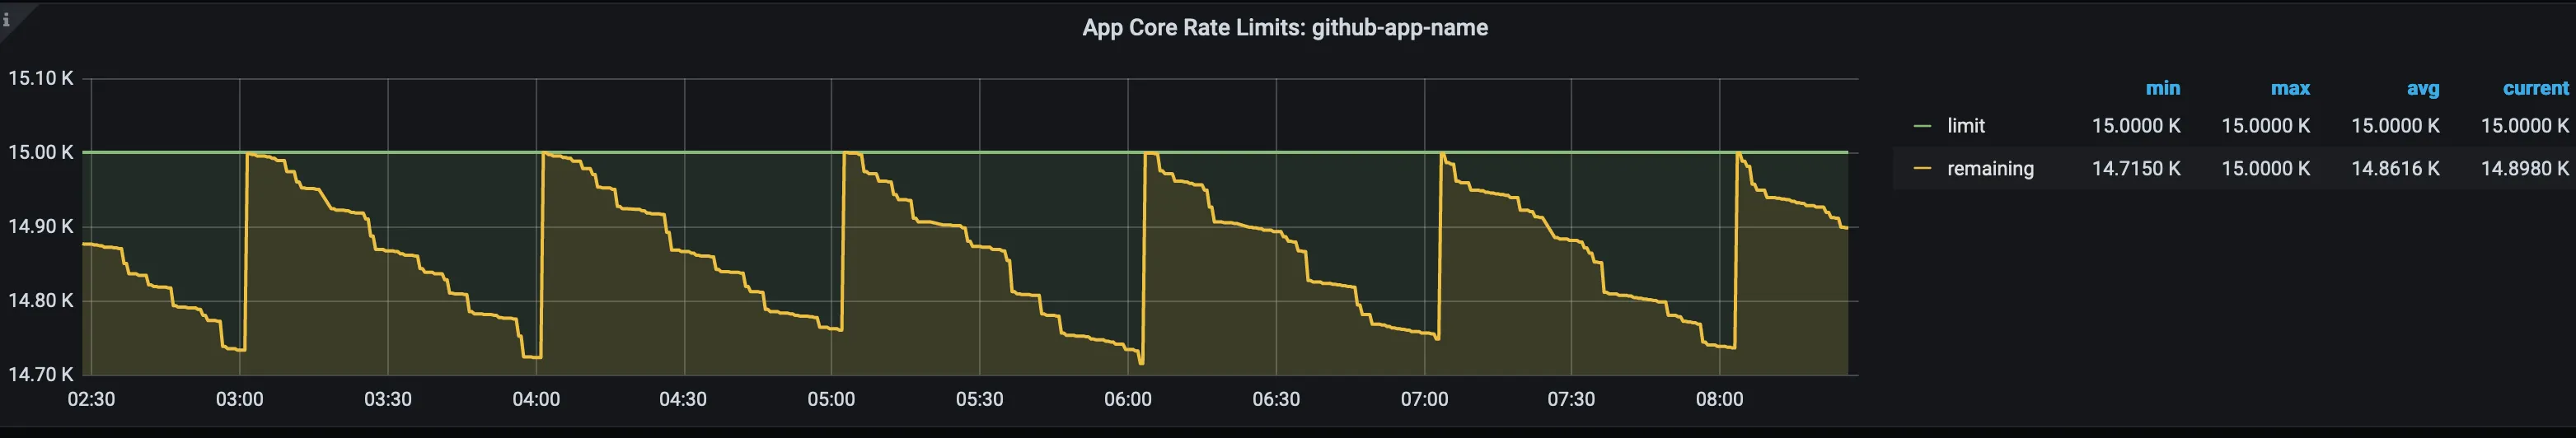
github_app_name_core{type="remaining"} 14659.0And our graphs in Kibana:
I can’t share the whole project, but the information above should be enough to get a good grasp on how to gather GitHub App rate limits and export them to Prometheus.
Of course, to make whole solution production-ready, don’t forget to add tests, linters, pipelines and, if needed, containerize it and create a Helm chart to deploy to Kubernetes.